Adjust your teaching accordingly and students can learn effectively
Instant report - Quickly analyse single exercise performance
The report provides the 5 major sections below for teacher to analyse lesson or after-lesson performance.
Page thumbnails: preview each student's screen with all pages, easy to review pages with handwriting or photos shoot by student.
Ranking: Display total score and chapter score ranking.
Score distribution chart: Display score distribution.
Learning objectives chart:Generated based on the learning objectives set at the questions of the exercise. It displays the whole class performance base on learning objectives. It also shows a radar chart with individual student and average student performance.
Data table:Provides data for each question and each student. Under each question there will be a pie chart showing the summarised performance of the question. Under each student there will be a bar showing overall performance of that student. Average score, reading time of each page will also be displayed. Data in the table can be exported to excel file.
Result overview - Overview performance of multiple exercises
In the "Progress" section, the system displays exercises shared to students, together with summarised data:
Overall performance bar will be displayed within each exercise, which includes the result of all students and all questions.
Open and submit timeswill be displayed within each exercise for teachers to quickly overview usage information.
When multiple exercises are displayed, you can quickly review multiple exercise results: You can select groups for comparison, or select single student to review his/her overall performance.
Customised Analysis - Organise learning results as you wish
You can set different parameters to generate different charts, analyse single student of overall group performance.
Customised performance charts allows you to freely choose people, period and learning content to generate single or compound charts. For the learning content, you can choose exercises or learning objectives to generate different analysis. You can find out student weaknesses if you use learning objectives analysis, and then adjust your teaching.
Usage chartslet teachers know the usage of the platform, including login times, reading times, submit times, section open times, stars acquired analysis. You can set which groups or students, and the period of data displayed.
Auto marking
Reduce repetitive marking tasks, gives you more time on teaching!
Questions with standard answers are marked automatically. E.g. Multiple choice, fill in the blanks, drag and drop, line matching.
Score and comment can be given to open-end questions.
The total score of the exercise will be summarised from both types of questions.
Provide marking tools such as e-pen with different colours, stickers.
You can also add text notes, audio notes as comment, to make your feedback more friendly.*
*Will be available within 2021
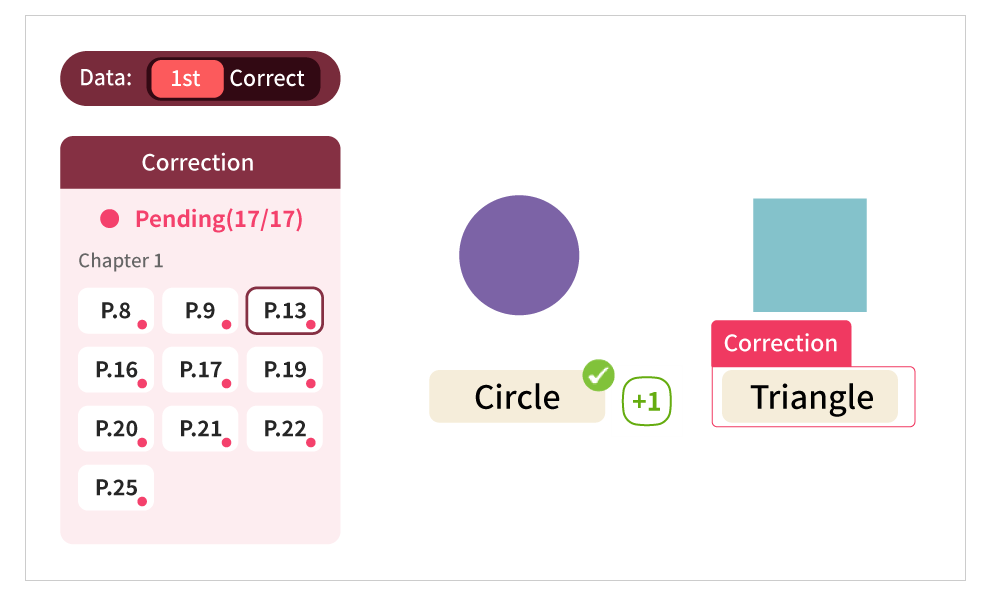
Correction mode - Review wrong answers easily
After teacher finished marking, you can change the mode to "correction". You can use this mode on different types of assignments.
Provide popup for quick navigation: When students open the assignment, a popup appears showing all the pages with wrong answers. They can simply click on the page button to go to that page directly.
Red frame will be displayed around questions with wrong answers, to let students know correction are needed.
Data from 1st submission and correction are stored separately. Teachers and students can view different sets of data.
Let your students learn effectively!
Download RainbowOne and enjoy for free with 2 teacher and 40 student accounts!